Working with Kubernetes from the terminal is powerful… but let’s be honest, it can also become painful very quickly.
At first, everything feels manageable:
kubectl get pods
kubectl logs my-pod
kubectl describe pod my-pod
But once your cluster starts growing, namespaces multiply, deployments scale, and microservices spread everywhere, the amount of commands, flags, and context switching becomes exhausting.
This is exactly where K9s comes in.
In this article, we’ll explore what K9s is, why it became one of the most loved tools in the Kubernetes ecosystem (as its
github page
shows so…), and how it can dramatically improve your daily developer or DevOps workflow.
Let’s go 🔥
What is K9s?
K9s is a terminal-based UI for Kubernetes that allows you to interact with your clusters in real time.
Instead of manually chaining dozens of kubectl commands, K9s gives you an interactive interface directly inside your terminal.
Simply install it on your wsl or linux terminal with:
brew install derailed/k9s/k9s
Then run it with:
k9s
And boom, your cluster is now navigable 😎
Pods, deployments, services, logs, events, namespaces, nodes… everything is accessible through a fast and reactive terminal UI.
It works using your existing kubeconfig and integrates naturally with any Kubernetes cluster you already access via kubectl.
No additional setup, no dashboard deployment and no browser required.
Why K9s became so popular
K9s solves a very real problem: Kubernetes observability from the CLI becomes harder as complexity grows.
The tool focuses on:
- Fast navigation
- Real-time visibility
- Operational efficiency
- Reduced cognitive load
And honestly, after a few days using it, going back to plain kubectl for everything feels extremely slow 😌
Core Features of K9s
1. Real-Time Cluster Navigation
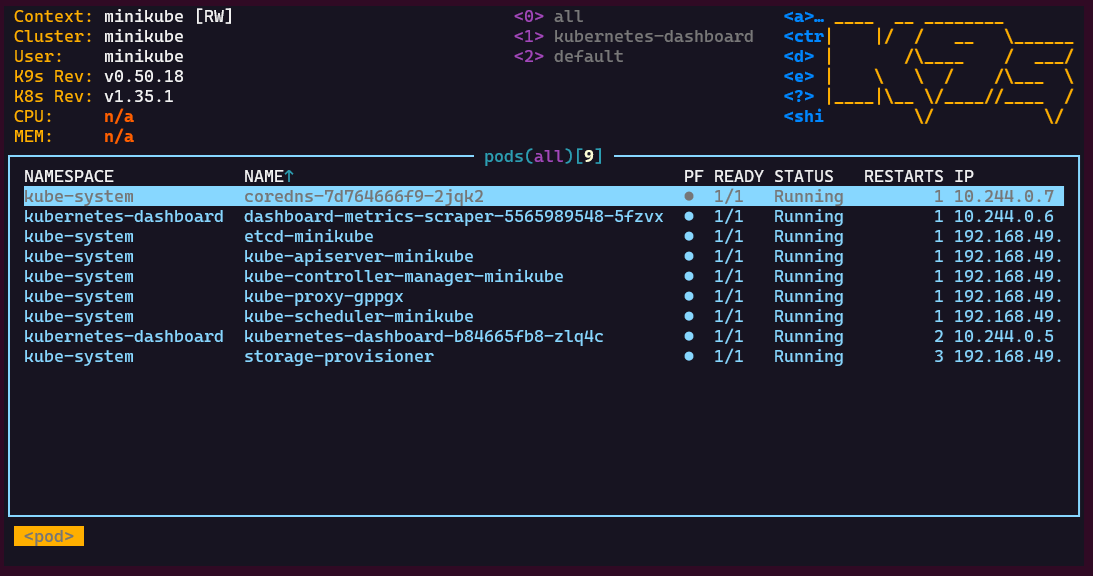
One of the first things you notice with K9s is that everything updates live.
You instantly see:
- Pod status
- Restart counts
- CPU usage
- Memory consumption
- Node assignments
- Resource age
Without constantly re-running commands like:
watch kubectl get pods
Your cluster is always updated in real time, and this changes the debugging and monitoring experience completely.
2. Extremely Fast Resource Switching
K9s uses a command system inspired by terminal editors like Vim.
You can instantly jump between resources by typing the related keyword in the searchbar:
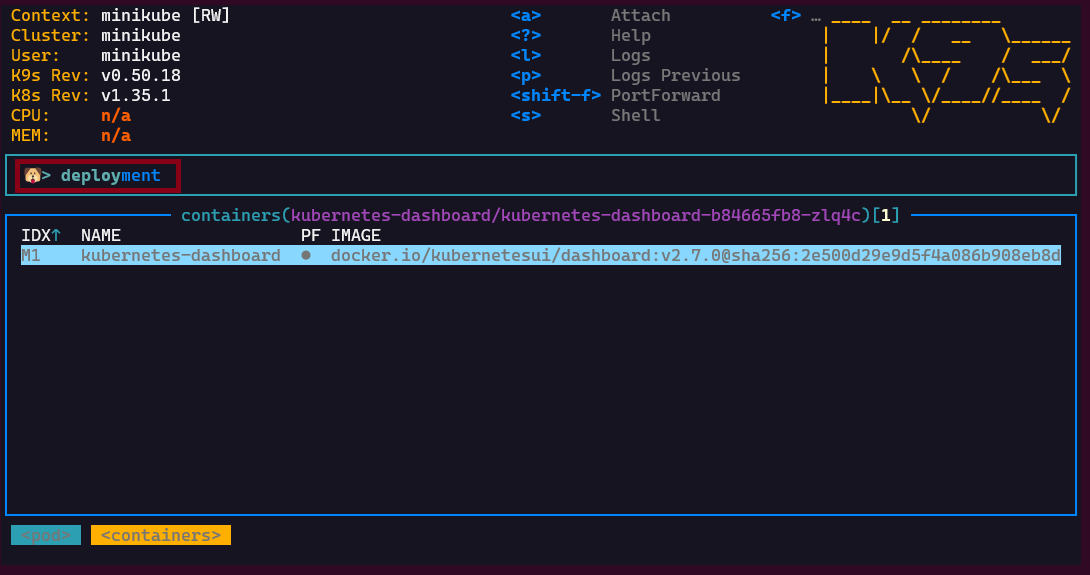
:pods
:deploy
:svc
:ns
:nodes
You can also:
- Filter resources with
/ - Describe resources with
d - Open logs with
l - Edit resources with
e - Delete resources with
x
Once muscle memory kicks in, navigation becomes ridiculously fast.
This is probably one of the biggest reasons engineers fall in love with K9s: Navigation 😄
3. Logs become actually pleasant to read
Anyone working with Kubernetes spends a massive amount of time reading logs.
Usually this means:
kubectl logs -f my-pod -c my-container
Over and over again.
K9s makes logs much more ergonomic, even if, of course, it doesn’t replace a real monitoring stack.
You simply select a pod and press:
l
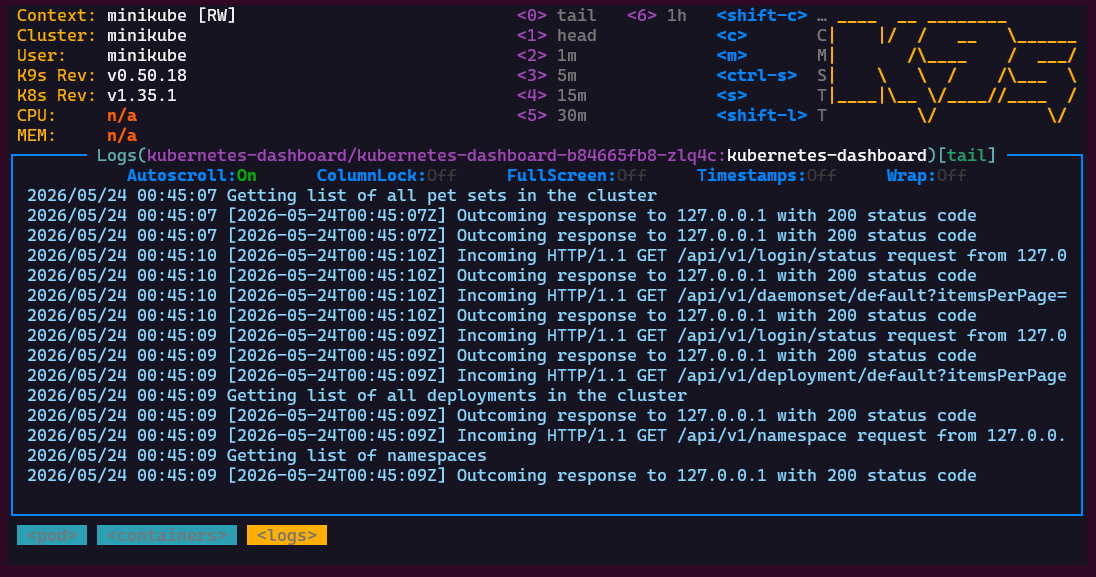
And you immediately get:
- Live log streaming
- Container switching
- Filtering
- Searching
- Timestamp visualization
4. Better understanding of Kubernetes Relationships
Kubernetes resources are deeply interconnected:
- Deployments create ReplicaSets
- ReplicaSets create Pods
- Services expose Pods
- Nodes host workloads
With raw kubectl, understanding these relationships often requires multiple commands and mental mapping.
K9s makes those relationships easier to traverse interactively and you kind of stop thinking in isolated commands.
K9s and Productivity
K9s shines especially in environments where clusters are large and noisy.
For example:
- Microservices architectures
- Multi-namespace environments
- Platform engineering teams
- Production debugging
- CI/CD troubleshooting
Instead of spending time remembering commands and flags, you spend time understanding what is actually happening inside your cluster.
K9s vs Kubernetes Dashboards
Some people may wonder:
Why use K9s instead of a graphical dashboard ?
Well, K9s is:
- Faster
- Lightweight
- Terminal-native
- SSH-friendly
- Easier to access in secured environments
Browser dashboards are useful, but they often require additional deployment, authentication, and maintenance, whereas K9s works anywhere your terminal works.
And in production environments, this is incredibly valuable.
About Performance
One of the best aspects of K9s is how lightweight it feels.
The tool is written in Go and consumes very little resources while remaining extremely responsive.
There is:
- No heavy UI framework
- No server component
- No cluster installation
- No additional infrastructure
It is simply a smart Kubernetes client, and having used it for weeks now, I can confirm it is blazingly fast 🔥
When should you use K9s?
K9s is especially valuable when:
- You work daily with Kubernetes
- Your clusters contain many services
- You spend time debugging production issues
- You frequently inspect logs and events
- You want faster operational workflows
For very small clusters or occasional Kubernetes usage, plain kubectl may still be enough.
But once operational complexity increases, K9s becomes a really good option.
Conclusion
K9s is one of those tools that instantly feels useful the moment you start using it.
It does not replace Kubernetes knowledge.
It does not replace kubectl.
And it does not magically simplify distributed systems.
What it does is remove friction.
And when you work with Kubernetes every day, reducing friction matters a lot.
If you are doing platform engineering, DevOps, cloud-native development, or simply spending too much time typing kubectl logs, then K9s is definitely a tool you should try 😊
Happy clustering 👨💻❤️